
Three Centuries of the Future on Margin
Part II of Howe Wang's series on the History of bubbles continues today for easy reading and listening.


Good Morning,
How three centuries of booms were built on credit, and how they break. This is part II in the series on: Bubbles of the past and how they compare to the AI bubble of today.
Listen 18 minutes
Read Part I here. How the AI ‘bubble’ compares to history 🏛️
Read the article that started it all here.
Today’s article is part II in the series.
The Context of Bubbles and the AI Tech Revolution
“We tend to frame historical bubbles as IQ tests because that lets us feel smarter in hindsight. Everyone was delusional. But the historical record is more complicated than that. Many episodes are misremembered. The South Sea Bubble, for example, wasn’t really about South America. It was a retail-facing financial instrument that allowed the public to participate in a large-scale conversion of British government debt into equity.” - Howe Wang.
The Historical Lens of Recurring Cycles of Investment in Mass Infrastructure
“The Future on Margin series lays out a recurring architecture. First, there is a legible future, something the public can see and imagine: railroads crossing continents, homes lit by electricity, the internet entering daily life. Second, there is a financing regime that pulls that future forward: installments, margin, holding-company pyramids, junk bonds, vendor credit. Third, there is mass access. Those financing tools are made available to the general public early, with low thresholds that turn belief into position size. Part I walked us through Mississippi, South Sea, frontier land, and railway manias. Part II looks at utilities, RCA, and the dot-com credit machine.”
Howe Wang writes the Procure.FYI Substack, which explores enterprise AI adoption, infrastructure buildouts, and the financing mechanics behind global technology trends as well as running a consultancy.
Works
In recent times he’s been closely following the AI Infrastructure, semiconductor industry and datacenter roll-out. Previously, Howe worked on ML and data teams at Lyft, and earlier as an investment analyst and a global infrastructure economist.
From $8M to $21B: How Geopolitics and Lip-Bu Tan’s Bet on Data Connectivity Created an AI Titan
An Overview of a Global and Dispersed Networking Ecosystem
Mellanox, NVIDIA, and the GPU Era - A Networking Story Spanning China, the US, and Israel
The Rise Nuclear and Rise of Small Modular Nuclear Reactors (SMRs)
Follow Michael Burry for more contrarian context on the AI Bubble

Michael Burry, the investor who shot to fame for calling the housing crash before 2008, has launched a Substack newsletter after deregistering his hedge fund, aiming to lay out in detail his increasingly bearish thesis on artificial intelligence.
Michael Burry’s position on the AI bubble is super fascinating (see bonus section at the end):
Burry has consistently compared the current AI enthusiasm to historical manias, calling OpenAI the “Netscape of our time” (referring to the dot-com pioneer whose hype preceded the 2000 crash). Burry emphasizes return on invested capital (ROIC) as the key metric for evaluating AI companies, arguing that massive capital expenditures (especially on hardware and infrastructure) have not yet translated into meaningful profit returns, pushing Big Tech toward less efficient, capital-heavy business models.
Burry has further warned that hyperscalers and AI firms are understating depreciation on hardware (e.g., chips with shorter useful lives due to rapid obsolescence), potentially overstating earnings by hundreds of billions across the industry from 2026–2028. He predicts this could lead to a drawn-out market decline, especially given passive index funds’ heavy exposure to AI names.
“….During the Industrial Revolution and the Services Revolution, the impacts on labor were so great that mandatory schooling was instituted and expanded to keep young people out of the labor pool for longer. We certainly have not seen anything like that (Yet as of 2026).” - Michael Burry.
Let’s now continue part II of our historical journey of the future on margins.

The Future on Margin (Part II)
How three centuries of booms were built on credit, and how they break
Part II: Utilities, RCA, and the Dot-Com Credit Machine (1924 - 2002)
See Part I Here
By the 1920s, the instruments were more sophisticated, holding companies, margin accounts, a central bank managing credit, but the recipe was unchanged: a future you can picture, plus a balance sheet that makes it cheap to own that future today.
V. Pyramids of Control: Utility Holding Companies, 1924 - 1932
Everyone could see where it was going - every home lit, every factory humming - but the path there stretched across decades. Electrification was a diffusion process, driven by relentless engineering logic: build larger networks, increase utilization, lower unit costs.
Chicago offers a clean early case because it also provides a central figure. Samuel Insull arrived there in 1892 after rising inside Thomas Edison’s circle and absorbing a crucial lesson: electricity only works economically as a system. His operating model emphasized large central stations, interconnection, and steady load rather than fragmented local plants. The effect was dramatic. Delivered prices in Insull’s system fell from roughly $0.20 per kilowatt-hour in 1892 to about $0.025 by 1909: scale economics at work. National adoption followed, but slowly. U.S. generating capacity nearly doubled from about 22 million kilowatts in 1922 to 43 million kilowatts by 1930, yet penetration remained uneven. As late as 1935, only about 10% of American farms were electrified. The technology was spreading, but the country was still early in the physical rollout.
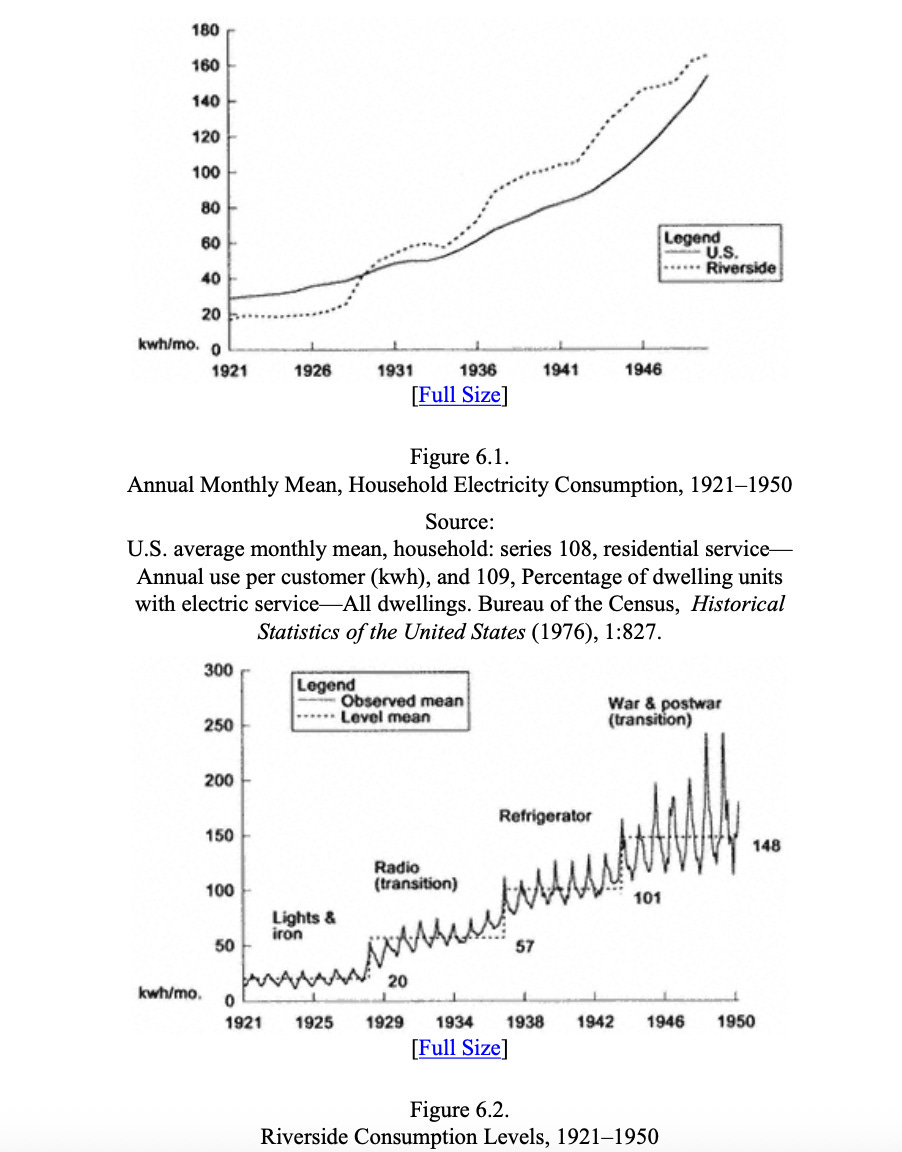
Exhibit 12: Annual Monthly Mean, Household Electricity Consumption, 1921-1950 Chart showing steady growth in household electricity consumption from near zero in 1921 to ~160 kwh/month by 1950, with both U.S. national average (solid line) and Riverside, California data (dotted line)
Riverside Consumption Levels, 1921-1950 Detailed consumption chart showing how new appliances drove electricity usage: “Lights & Iron” (~20 kwh/mo), Radio transition period (~57 kwh/mo by 1929), Refrigerator adoption (~101 kwh/mo by 1938), and War & power transition reaching ~148 kwh/mo by 1946.
Source: Ronald C. Tobey, Technology as Freedom: The New Deal and the Electrical Modernization of the American Home (Berkeley: University of California Press, 1996), Figures 6.1 and 6.2. Data from U.S. Bureau of the Census, Historical Statistics of the United States (1976), 1:827, Series 108 (household electricity consumption) and Series 109 (percentage of dwelling units with electric service).
The 1920s compressed that long engineering curve into a short capital-markets event. Electrification was visibly advancing, utilities were consolidating, and the sector looked unusually stable compared to more cyclical industries. What turned that stability into a boom was not optimism alone, but financial engineering.
Wall Street’s instrument was the public-utility holding company. Instead of owning a regulated operating utility, the entity that owned the wires, billed customers, and answered to state commissions, investors bought equity in companies that owned utilities. Those holding companies could issue bonds, preferred stock, and common stock to acquire additional utility securities, which in turn supported further issuance. Layered repeatedly, this produced pyramiding: control flowed upward through thin equity slices, while leverage accumulated throughout the structure. Operating utilities were regulated; holding companies often were not, exploiting gaps between state oversight and interstate finance.
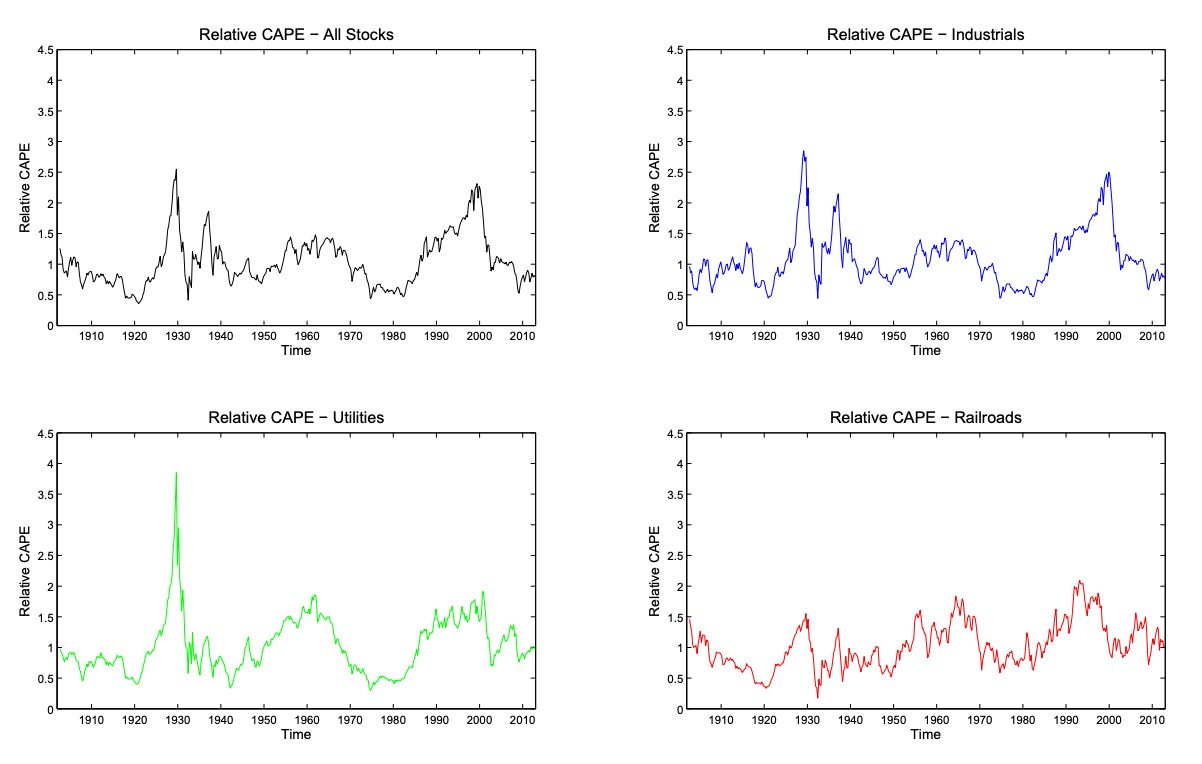
Exhibit 13:Utilities and Other Sector CAPE Ratio Chart (1920s-1930s) Chart showing cyclically-adjusted price-to-earnings ratio reaching record level above 60 in Q3 1929, followed by 75%+ decline through Q2 1932. Demonstrates extreme valuation disconnection from fundamentals.
Source: NBER Working Paper 20370. https://www.nber.org/system/files/working_papers/w20370/w20370.pdf
Insull became the emblem of this architecture not because he invented it, but because of its scale. By 1930, one contemporary account described roughly $27 million of capital investment at the top controlling more than $500 million of underlying assets. A small amount of equity exercised control over a vast asset base financed by multiple layers of debt and preferred claims. The arrangement appeared resilient as long as refinancing was easy and security prices held.
Valuations reflect how far this logic was carried. The Utilities sector cyclically adjusted price-to-earnings ratio (CAPE), which smooths earnings over a 10-year real average, reached a record level just above 60 in Q3 1929. Barron’s warned that summer about unrestrained speculation in utilities and an accelerating merger wave that far outpaced underlying economics.
When the system unwound, it did so through financing rather than technology. After the 1929 crash, the market for new issues weakened and credit conditions tightened, cutting off the refinancing channel that holding-company structures quietly depended on. Insull’s control rested heavily on pledged stock, so falling prices immediately translated into declining collateral values. That decline triggered margin pressure, forced sales, and challenges to control itself. At that point, the market price of utility securities stopped functioning as a measure of optimism and became an operational constraint: it determined whether debt could be rolled, obligations met, and control maintained.
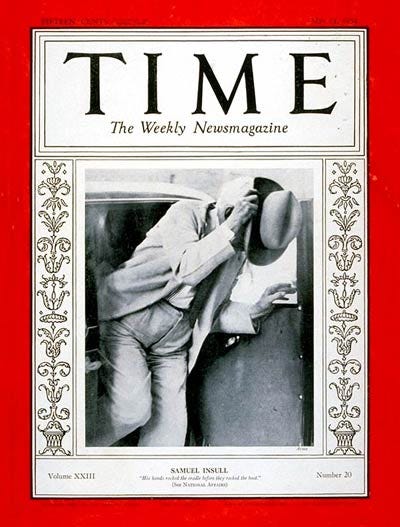
Exhibit 14: TIME Magazine Cover - Samuel Insull TIME Magazine cover featuring Samuel Insull dated May 14, 1934, after his utility empire’s collapse and subsequent indictment. Captures the transformation from “utility king” to cautionary tale.
Source: TIME Magazine, May 14, 1934. http://content.time.com/time/covers/0,16641,19340514,00.html
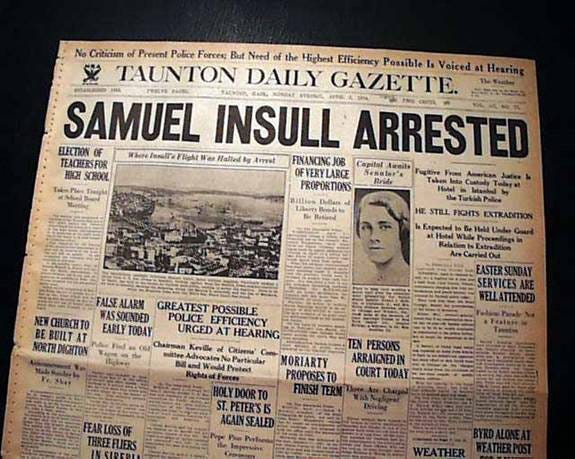
Exhibit 15: Source: American Business History, “From Hero to Hated: America’s Most Tragic Entrepreneur.” https://americanbusinesshistory.org/from-hero-to-hated-americas-most-tragic-entrepreneur/
Once that mechanism flipped, the unwind was nonlinear. Even though underlying electricity demand remained relatively stable, the pyramided capital structure could not survive without continuous access to capital markets. Between Q3 1929 and Q2 1932, the utilities sector lost more than 75% of its real total return. Insull’s empire entered receivership in 1932, wiping out hundreds of thousands of shareholders and bondholders. Insull was pushed out of management and left the U.S. He was indicted on fraud/embezzlement-related charges, then fought extradition. The political response, the Public Utility Holding Company Act of 1935, codified the lesson by dismantling multi-tier holding companies and re-anchoring the sector to simpler, geographically constrained, regulated balance sheets.
VI. Buying the Tollbooth: Radio and RCA - United States, 1927 - 1932
Radio is another clean example of how a real transformation can still produce a classic, levered equity blow-off. The technology was genuinely new, adoption was compounding fast, and the buildout required real capital. Factories had to be expanded, parts supply chains had to be built, and thousands of households adopted radio equipment as utility. Radio advertising was tiny in the late 1920s, then rose fast: $4.8M (1927), $14.1M (1928), $26.8M (1929), $40.5M (1930), $56.0M (1931), $61.9M (1932), and it kept growing into the late 1930s.
RCA became the stock that concentrated that whole story. It was not just “a radio company.” It sat on the industry’s choke points: patents, licensing, and the network economics of broadcasting. Investors love a gatekeeper because it makes the end state feel simpler. You do not have to pick the winning set manufacturer or the winning station. You buy the company that looks like the tollbooth.
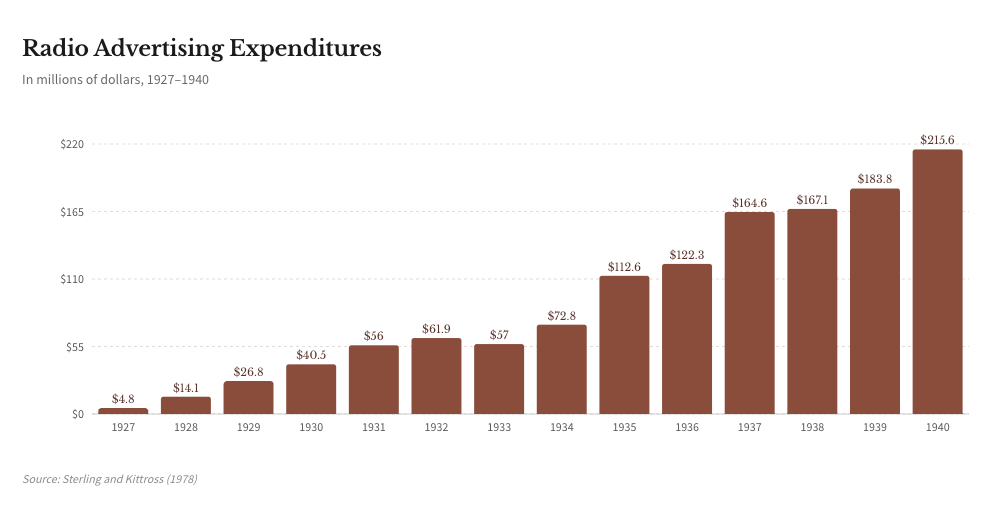
Exhibit 16: Radio Equipment Sales Growth Chart (1922-1929) Chart showing explosive growth in radio equipment sales from $60M (1922) to $843M (1929), demonstrating the genuine technological adoption underlying the stock speculation.
Source: Economic History Association, “The History of the Radio Industry in the United States to 1940.” https://eh.net/encyclopedia/the-history-of-the-radio-industry-in-the-united-states-to-1940/
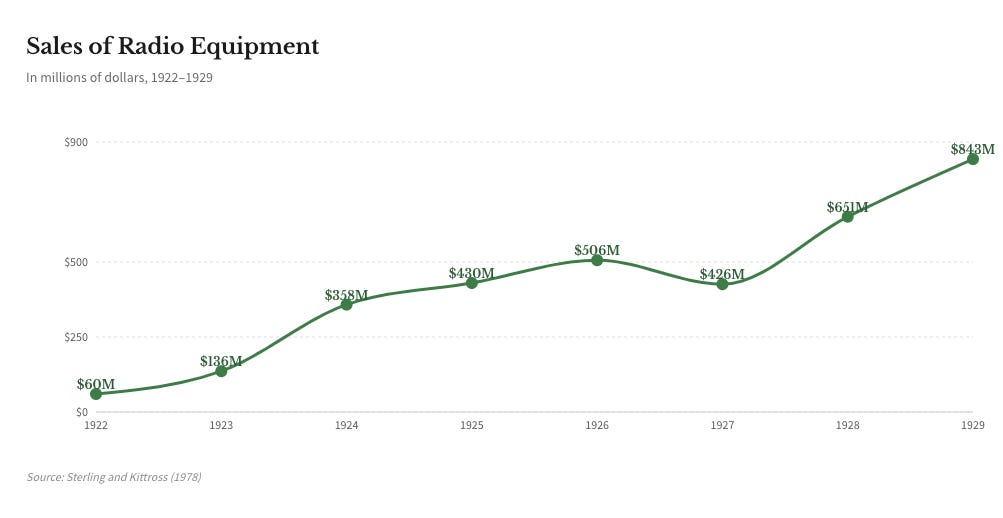
Exhibit 17: Radio Advertising Revenue Growth (1927-1932) Data showing radio advertising revenue climbing from $4.8M (1927) to $61.9M (1932), even as RCA stock collapsed—illustrating the divergence between technology adoption and equity prices.
Source: Economic History Association, “The History of the Radio Industry in the United States to 1940.” https://eh.net/encyclopedia/the-history-of-the-radio-industry-in-the-united-states-to-1940/
Then came the credit pathway. The late-1920s stock market made it easy to own growth with borrowed money. The mechanism was margin and broker loans. Investors could buy shares with a partial cash down payment and borrow the rest through brokers, funded by a swelling pool of call loans and other short-term credit. In the run-up, broker loans tied to carrying securities rose sharply, from roughly $4.4B (Jan 1928) to around $8.5B (Oct 1929). That structure does two things. It amplifies the upside on the way up, and it turns a price decline into forced selling on the way down.
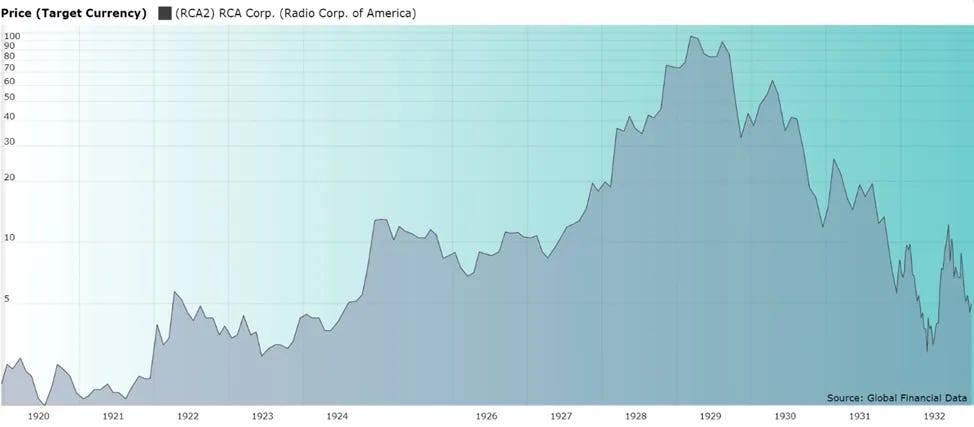
Exhibit 18: RCA Stock Price Chart (1922-1932) RCA’s dramatic rise from ~$5 (1922) to $113 (1929 peak) and subsequent 98% collapse to $2.50 (1932), showing classic boom-bust pattern in a “gatekeeper” technology stock.
Source: Bryan Taylor, “RCA and the Roaring Twenties,” Finaeon. https://finaeon.com/rca-and-the-roaring-twenties/
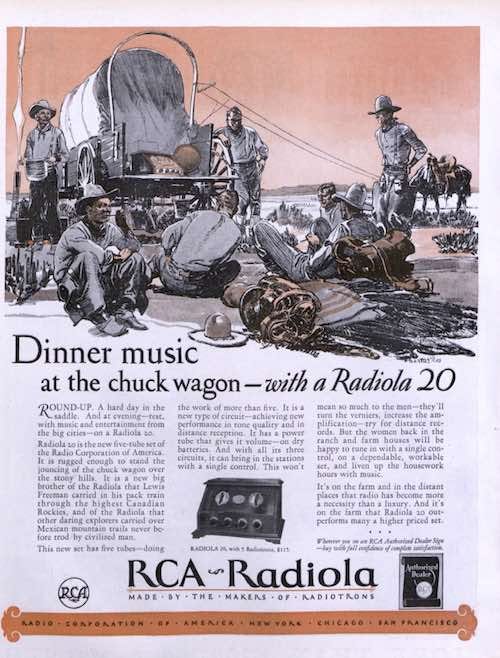
Exhibit 19: RCA Advertisement (April 1, 1926) Vintage RCA advertisement showing the marketing of radio technology to consumers during the adoption phase. Illustrates how real products underpinned the speculative bubble.
Source: Saturday Evening Post, “RCA’s Home Entertainment Center” (2017 retrospective). https://www.saturdayeveningpost.com/2017/06/rcas-home-entertainment-center/
In 1929, RCA, at its valuation peak, bought Victor Talking Machine, a manufacturing and distribution empire in consumer audio. The acquisition itself is a normal strategic move in a fast-growing industry. The telling part is how naturally equity becomes currency. RCA reclassified 1,500,000 common shares into 7,500,000 shares, and then issued large blocks of stock in connection with the deal. A stock split and a bigger share count do not change fundamentals overnight. They make it easier to distribute, easier to finance, and easier to use as acquisition money. In boom markets, that happens, a lot.
Then comes the regime change. Once stock prices start falling, collateral falls with them. Brokers and lenders pull back. Margin turns from accelerant into trap. RCA’s stock, split adjusted, traded around $5 in 1922, hit $113 at a point in 1929, and was back around $2.5 in 1932. Even after the crash, parts of the real radio business kept growing. Advertising dollars rose into the early 1930s. But the stock had already done its job in the market cycle. The trade was priced for perfection and financed for momentum. Once the financing window narrowed, the market stopped paying “end state” prices for medium-term progress.
VII. Credit Disguised as Demand: The Internet Boom - United States, 1995 - 2002
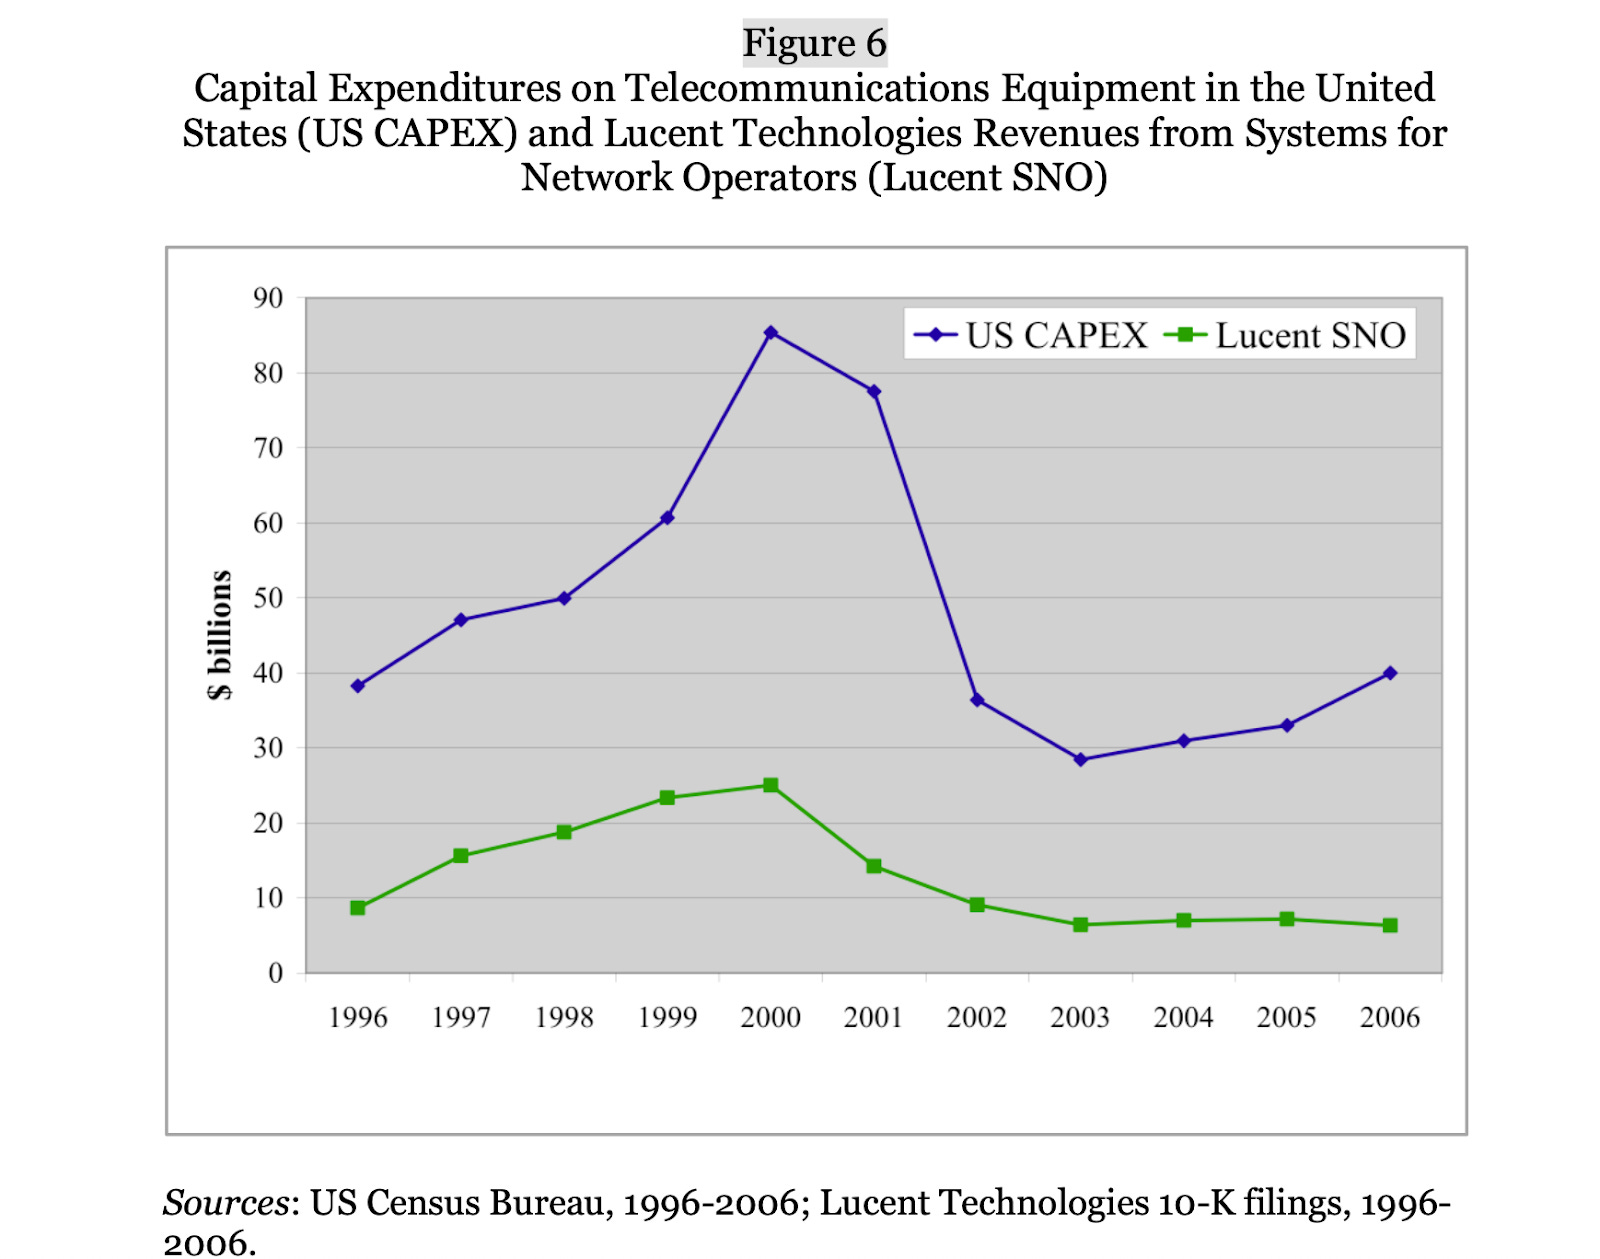
Exhibit 20: Capital Expenditures on Telecommunications Equipment in the United States (1996-2006) US telecom equipment capital expenditures rising from ~$40B (1996) to peak of ~$87B (2000), then collapsing to ~$37B (2002) before stabilizing at ~$40B (2006). Lucent’s SNO revenues tracked this pattern, climbing from ~$9B (1996) to ~$25B (2000), then plummeting to ~$7B (2003-2006).
Source: William Lazonick and Edward March, “The Rise and Demise of Lucent Technologies,” Business and Economic History On-Line, Vol. 9 (2011), p. 35. Data from US Census Bureau, 1996-2006; Lucent Technologies 10-K filings, 1996-2006. http://www.thebhc.org/publications/BEHonline/2011/lazonickandmarch.pdf
By late 1999, the internet trade had crossed the threshold that matters in every mania: the end state became legible. You could picture it. Shopping moved online. Advertising followed eyeballs. Every company needed a website, then e-commerce, then “infrastructure.” The promise was visible in daily life, and easily turned into a valuation boom. But the boom did not run on imagination alone. It ran on a credit pathway that let investors and companies pull future demand into the present.
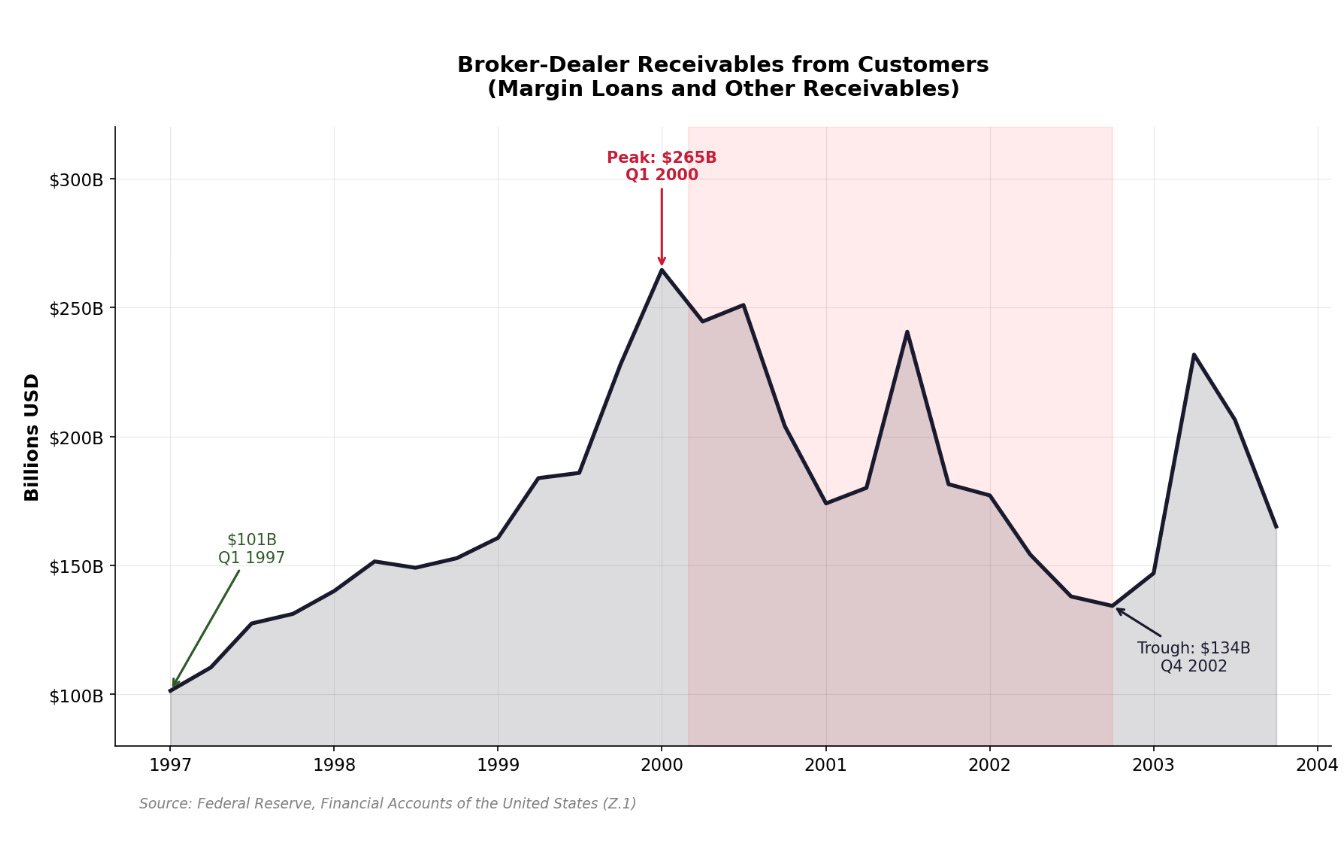
Exhibit 21: Broker-Dealer Receivables from Customers - Margin Loans and Other Receivables (1997-2004) Chart showing broker-dealer margin loans and customer receivables rising from ~$110B in Q2 1997 to peak of $263B in Q1 2000 (coinciding with NASDAQ’s March 10, 2000 peak at 5,048)
Source: Federal Reserve, Flow of Funds Accounts of the United States, Table D.2 (Broker-Dealers).
On the market side, the mechanism was leverage against rising prices. NYSE margin debt climbed from roughly $100 billion in 1996 to $278 billion at the March 2000 peak—nearly tripled. Investors controlled large positions with small cash down, brokers financed the rest. And the IPO market functioned as a credit window with a stock-exchange wrapper—public capital for companies that couldn’t have borrowed a dime, available until the day it wasn’t. In 1999 alone, 477 companies went public, raising $69 billion, many at valuations that assumed a decade of growth. When the window closed in 2000, it closed fast: 2001 saw fewer than 80 deals. On the real-economy side, the buildout was capital-intensive and funded like a boom. Telecom capex grew at a 23% compound annual rate from 1995 to 2000, fueled by high-yield debt. Telecom companies—Global Crossing, 360networks, Williams—loaded up on junk bonds against incomplete buildouts, betting the new-issue window would stay open long enough to reach breakeven. It didn’t. When credit spreads widened in 2000, forty-seven telecom startups went bankrupt within three years. The technology still worked. The financing didn’t.
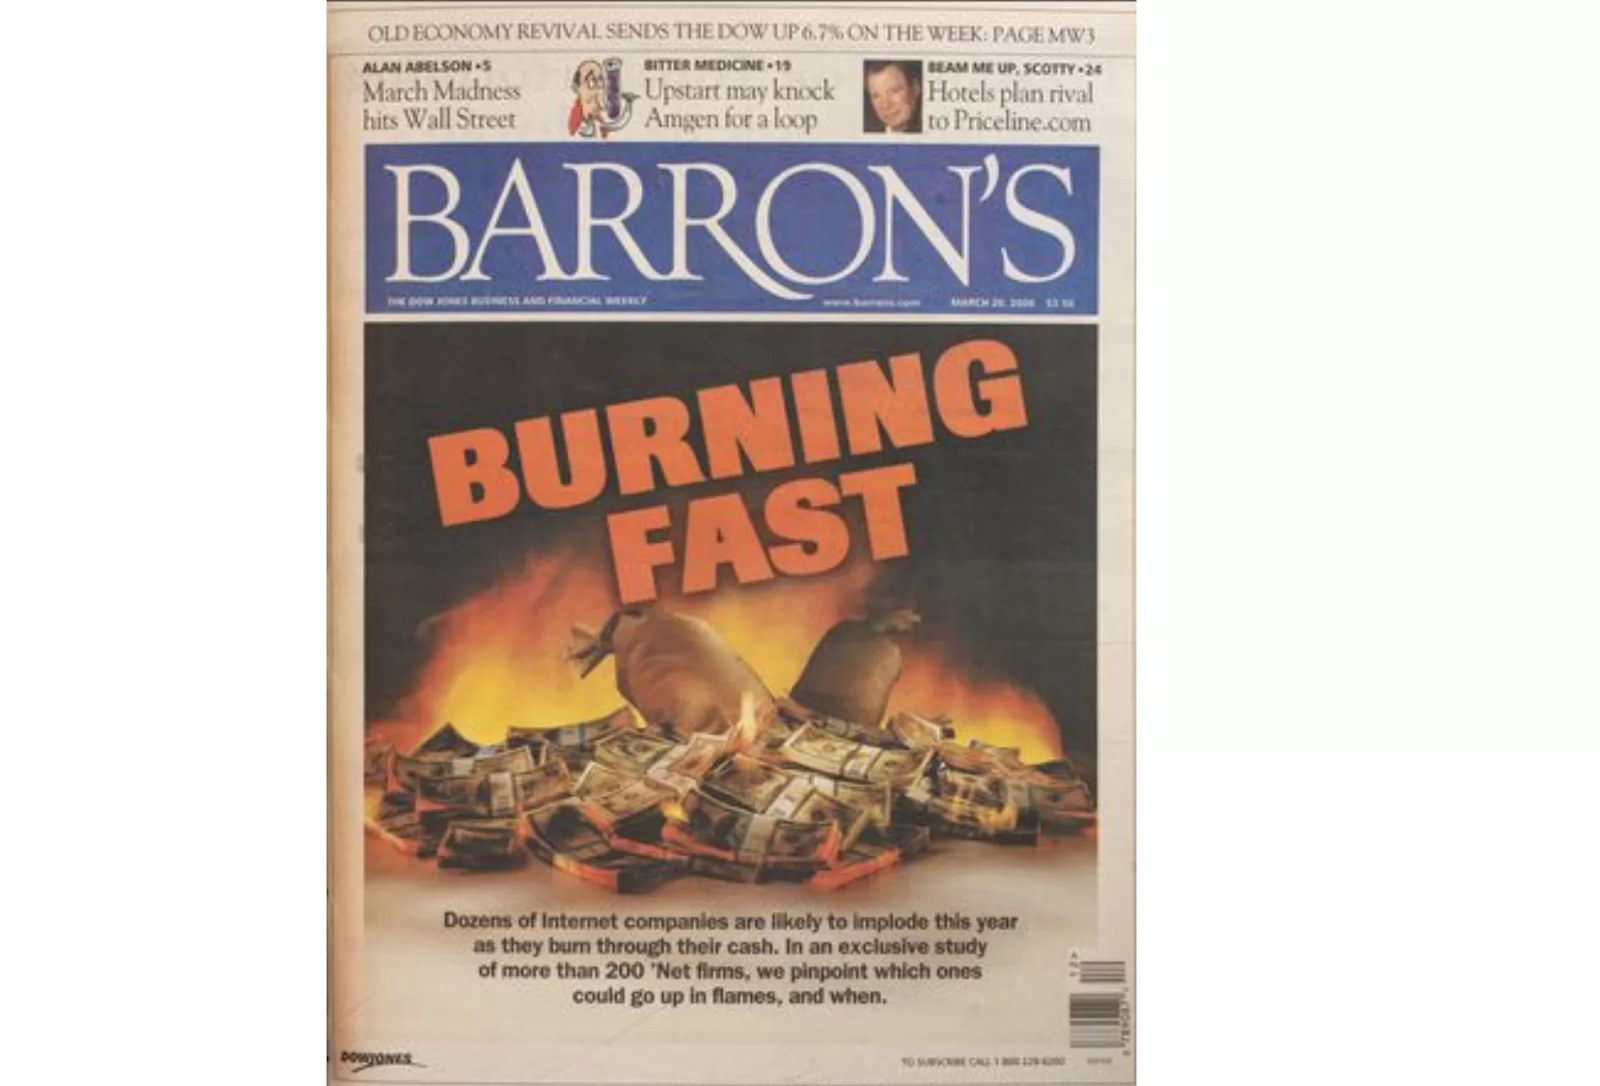
Exhibit 22: Barron’s “Burning Up” Cover (March 20, 2000) Iconic Barron’s magazine cover published 10 days after NASDAQ peaked at 5,048, featuring flames consuming money and headline “Burning Up; Warning: Internet Companies are Running Out of Cash—Fast.” One of history’s most prescient market-top calls.
Source: Barron’s, March 20, 2000. https://elinversordebolsillo.com.ar/en/burning-up/
Then there was vendor financing. Lucent opened a $2 billion credit line for WinStar in 1998, booking revenue while quietly becoming WinStar’s lender. By fiscal 2000, Lucent had committed up to $8.1 billion in customer credit and guarantees. Nortel had extended $3.1 billion. Cisco, $2.4 billion. The equipment makers had become shadow banks. When Lucent refused WinStar an additional $90 million in early 2001, WinStar went bankrupt and Lucent wrote off $700 million. Multiply that across the industry. At the top, equity became acquisition currency. Cisco did 23 deals in 1999 - 2000, almost all in stock. JDS Uniphase bought SDL for $41 billion in shares at the absolute peak, then wrote off $50 billion within a year.
So what broke in 2000 - 2002 wasn’t one earnings miss or one fraud. It was the financing stack - high-yield debt, vendor credit, the IPO window, and stock-as-currency - that had underwritten the pace of the buildout and the willingness to price distant demand as near-term reality. The proximate trigger was the Fed: Greenspan raised rates six times between June 1999 and May 2000, from 4.75% to 6.5%. But rate hikes alone don’t collapse a system. What collapses a system is a structure that requires perpetual confidence. Stock prices fall, so collateral values fall, so margin calls force selling, so prices fall further. Credit ratings get cut, so debt markets close, so companies issue dilutive equity at the worst moment. One borrower defaults, so lenders reprice the whole sector, so spreads widen, so more borrowers default. The loop is reflexive: one wobble in a tight enough structure and the whole thing starts to unwind. Once that architecture cracked, projects got canceled, inventories piled up, and capex that had compounded at 23% annually fell at 28% for three years. The internet kept spreading. But the market stopped paying end-state multiples for medium-term progress, and stopped extending the credit that made the carry trade feel effortless.
Same Architecture, Different Century
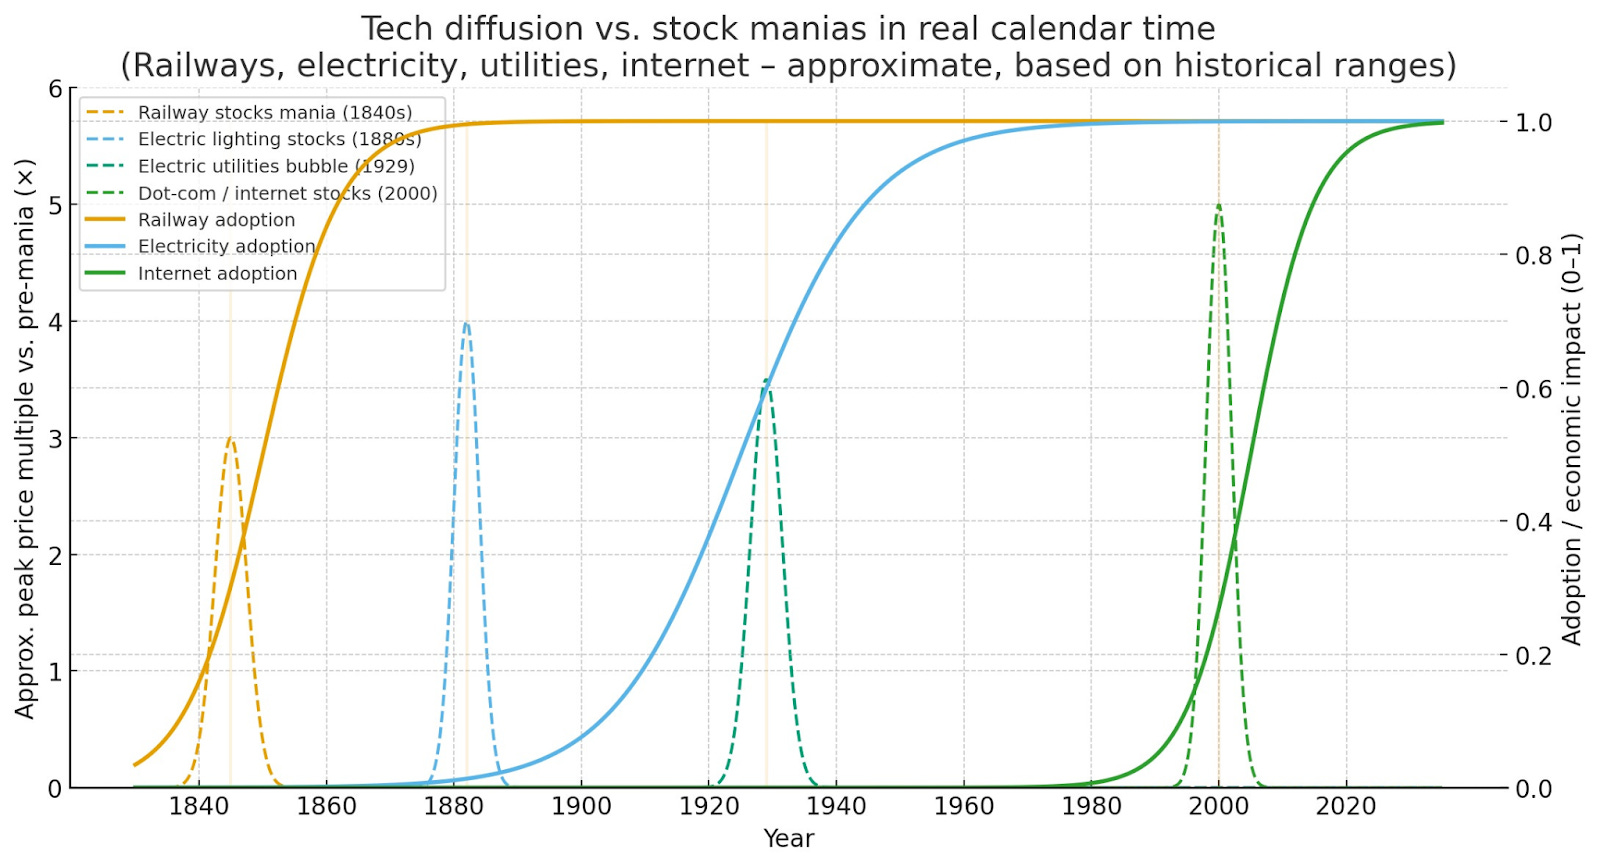
Exhibit 23: Stylized Adoption vs Valuation Curve
Every boom in this essay follows the same sequence. A technology arrives whose end state is easy to picture: a continent connected by rail, every home electrified, commerce rewired by the internet. That clarity is the first ingredient. The second is a financing regime that lets you own the future now. When a vivid future meets cheap credit, markets don’t wait for a 40-year diffusion curve. They compress it into three to five years of price action.
Early on, the fundamentals feel decisive: adoption metrics, earnings revisions, technical milestones. The market is building a story, and the evidence keeps arriving on schedule. But three or four years in, once the financing stack is fully extended, the question quietly changes. The market stops asking, “Is this working?” and starts asking, “Can this still be financed?” At that point, everyone with exposure becomes a salesman, because the structure needs belief to remain liquid.
Then sentiment cracks. It rarely takes much: a rate hike, a missed quarter, a magazine cover that does the math, a single default that forces lenders to reprice an entire sector. The trigger can be small: credit tightens, refinancing stops, and the bridge to the future can’t be funded anymore. The technology keeps working, but the market stops financing the optimism.
The people who underwrote railroad bonds and bought RCA at the top were usually right about the direction of history. The future they believed in arrived. It just didn’t arrive on the timeline their leverage demanded. So the question in any boom isn’t whether the technology is transformational, it usually is. The question is whether you’re still in the phase where that matters.
Michael Burry related Bonus Section🌊

 | A guest post by
|